
Executive comparative premise
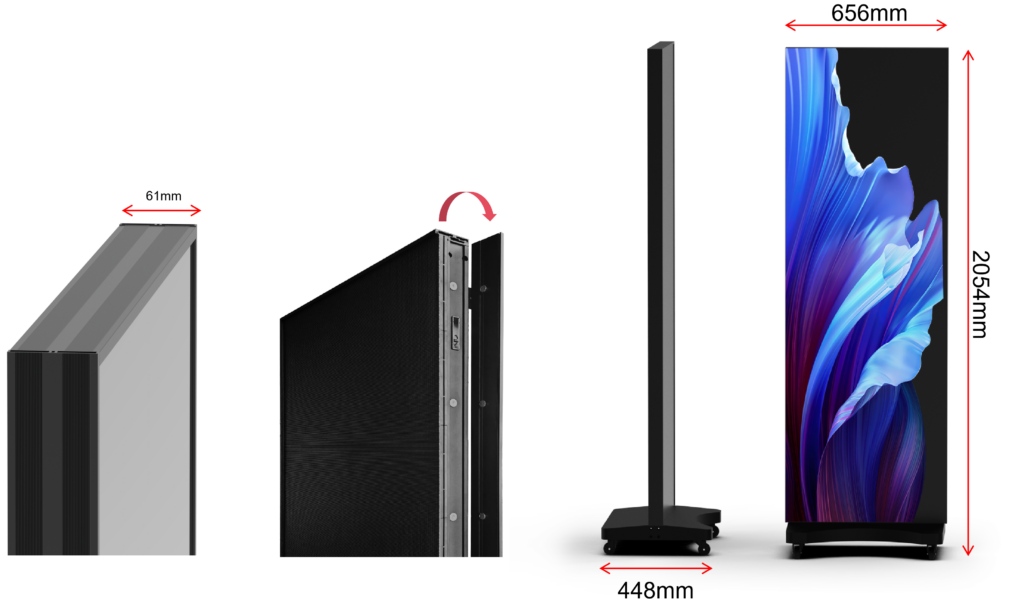
Procurement teams face a narrow set of financially material choices: high-resolution indoor tiles, outdoor full-color banks, or compact advertising formats such as the led poster display. This piece compares those options through the lens of cash flows, asset depreciation, operational burden and residual value, so decision-makers can quantify trade-offs rather than rely on marketing claims.
What to put on the spreadsheet
Start with three columns: CapEx, Annual OpEx, and Useful Life. CapEx includes hardware, installation and integration fees. OpEx should account for energy, routine maintenance and annual software licenses. Useful life must reflect realistic failure modes — LED modules typically de-rate before complete failure. Use conservative assumptions: expect significant servicing between years 3–7. Discount projected cash flows at your internal hurdle rate to compare net present costs per thousand nits or per square meter of usable display over the asset life.
Technical variables that change value
Pixel pitch, peak brightness (nits), refresh rate and ingress protection directly influence revenue potential and operating expense. Smaller pixel pitches increase initial cost and integration complexity but raise CPM for fine-detail advertising. Higher brightness reduces lifetime if run constantly at peak; budget for brightness control and content scheduling. Ask vendors for measured performance curves and module MTBF, not just manufacturer-rated lifespans. Control system licensing and redundancy design affect uptime — and therefore revenue exposure — much more than minor differences in initial price.
Comparing vendor propositions
Evaluate total vendor value by comparing warranties, replacement lead times, and on-site service SLAs. A low headline price with a three-year warranty and long replacement windows can double unplanned downtime costs. Factor spare-part pools and remote-diagnostics capabilities into expected downtime hours. Prefer contracts with defined service credits tied to display availability; they convert qualitative support promises into quantifiable financial adjustments.
Risk-adjusted ROI scenarios
Build best-, base- and worst-case scenarios that tweak utilization, ad rates and downtime. Best case assumes high utilization with scheduled brightness management; worst case increases failure rates and replacement costs. Run sensitivity to key drivers: a 10% drop in utilization or a 20% higher power cost often shifts vendor ranking more than a 5% price difference on the purchase order.
Real-world anchor and vendor due diligence
At trade events such as Integrated Systems Europe in Barcelona, buyers repeatedly confirm that modular designs simplify repairs and accelerate ROI; attendees often report shorter payback when vendors support local spare-part distribution. Validate vendor claims by requesting references at comparable venues and verify field performance against third-party reports. Practical checks include hands-on module swaps, measured brightness over time, and a demonstration of the content-management system. For compact, networked solutions that promise low-touch operations, evaluate a certified smart led poster display as a benchmark for integration simplicity and remote monitoring effectiveness.
Common procurement mistakes
Purchasers often optimize only for headline price, ignore continuity of content delivery, or accept untested control software. Don’t conflate warranty length with responsiveness. Avoid one-time pilots that don’t exercise real operational loads; pilots should run on live schedules and full brightness to reveal thermal and power behaviors.

Synthesis and recommendation
Compare on a normalized per-unit-of-service metric (for example, NPV cost per operational hour at contractual availability). That approach surfaces the highest-impact differences: service responsiveness, spare-part logistics, and realistic degradation curves. For teams aligning procurement with predictable financial outcomes, HDC provides configuration choices and service models that map cleanly to the evaluation framework above, enabling clearer forecasting and fewer surprises during the asset lifecycle.